AI in data analytics is already part of almost every data analyst’s workweek. In Alteryx’s 2025 survey of 1,400 data analysts, 97% of respondents said AI tools speed up their daily tasks. The same survey found that 76% still prepare data by hand in spreadsheets.
These results are very interesting, as they clearly show where things stand today. AI handles the mechanical work very well. Manually writing SQL queries is becoming increasingly obsolete; the same is happening with coding in Python, R, or any other tool analysts use. AI can also handle tasks like cleaning data, drafting initial insights or result summaries, and running automated reports. However, AI is still weaker in tasks that rely heavily on context. Without that context, it doesn’t know what question the business needs to ask. Without deeper analysis, separating correlation from causation might also be challenging. Used without human review, AI output also drifts toward generic findings that repeat the obvious.
In this guide, we explore the connections between AI and the analytics workflow. For each stage, we assess what part AI does well and where analyst input is needed. Our aim here is not to put analysts and AI on opposite ends of the spectrum competing with each other. We believe there is no inherent competition between analysts and AI. Applying AI to analytics work can enhance quality, efficiency, and creativity.
What AI for data analytics covers
AI in data analytics uses machine learning and large language models to speed up how teams access, prepare, analyse, and report on data. Analysts direct the work, check the output and decide what the results mean for the organisation.
The phrase covers more than chatbots. In practice, analysts work with three kinds of AI, each fitting a different part of the job.
Machine learning models have been part of analytics for years. They forecast demand, score customers for churn risk and flag unusual movements in a metric. What has changed is how much effort they require. Modern tools build, tune and monitor standard models with little setup.
Large language models are the newest addition. They have changed daily analytics work the most. They turn a plain-English question into SQL, write the Python for a cleaning step and draft commentary from a results table. They work from patterns in text and code. They know nothing about your business unless you tell them.
Agents connect those steps. An agent can take a question, write a query, run it, inspect the result and draft an answer, with the analyst stepping in only at the end. Databricks Genie and Snowflake Cortex Analyst are two examples already built into data platforms.
Each kind of AI also breaks in its own way. Forecasting models go wrong when the future no longer looks like the past. Language models can write SQL that is technically correct but uses the wrong definition of revenue, and nothing in the output warns us. Agents chain steps together, so one early mistake can carry through to the final answer.
This is where the analyst role grows. AI makes the first draft of almost any analysis fast and easy to generate. There is no doubt about it. Judging whether the draft is right, how to improve it, asking additional questions, and deepening it is still a human job and requires someone to know not only the organisation’s details but also how to connect different pieces. This strongly supports the need for data analysts, especially those with a broad skill set.
How AI enhances each stage of the data analytics workflow
Most analytics work follows a similar flow, from a business question to a decision, with a possible feedback loop. AI helps at every stage, but its role shifts along the way. The early, mechanical steps lean on AI. Later steps, where findings meet the business, rely on the analyst.
Framing the question
Every analysis starts with a question, and a vague one wastes the work that follows. AI makes a useful sparring partner here. Conversion rate is a very typical question most analysts encounter at some point in their careers. AI can help by generating a list of potential factors that could explain it. Such a list will be wider than someone could generate in 5 minutes. Of course, that doesn’t mean it would be complete; the more context the model has about the organisation, the better the answers will be.
The analyst, together with stakeholders, decides which question matters. That depends on what the business plans to do with the answer and which decision it will change, but AI widens the options and helps generate plausible hypotheses.
Accessing data and writing SQL
For most analysts, this is where AI saves the most time. Language models turn a plain-English request into a working query in seconds. They also explain unfamiliar SQL, rewrite slow queries and translate between dialects when a team moves warehouses.
Any query still needs careful review and assessment. The analyst has to check joins, filters and metric definitions before trusting the number. And teams that document those definitions get far better results from AI, as the next section shows.
Cleaning and preparing data
Preparation takes a large share of most analysts’ time, and much of it is repetitive. AI writes the code to standardise formats, merge sources and fill or drop missing values. It flags outliers, duplicate records, and columns with inconsistent types.
Flagging an anomaly is different from understanding it. A spike in orders could be a data error or a real promotion. A gap in a time series could be a tracking outage or a store that closed. The analyst has to decide which anomalies to fix and which to keep, because those choices shape every downstream result.
Exploring a new dataset
AI enables analysts to quickly familiarise themselves with a new dataset. It summarises distributions, flags obvious relationships, and suggests which dimensions to break results down by. Work that once took dozens of exploratory queries now takes a few prompts.
AI finds what the data contains. It cannot see what looks odd given how the business runs: a region that should be growing, or a product that should not sell in winter. Observations like these often lead to the most useful analysis, and they come from the analyst.
Forecasting and modelling
For closed, well-defined tasks, AI makes modelling much faster. It fits standard forecasting and classification models, compares them and even writes the code to run them. Analysts without deep data science training can now build a sound baseline model on their own.
The analyst chooses the model and judges whether it fits reality. A forecast that ignores a planned price change will look accurate in testing and fail in use. So will a churn model trained on a period with an unusual campaign. Checking a model against what the business knows is crucial to make it valuable for the organisation.
Explaining why something happened
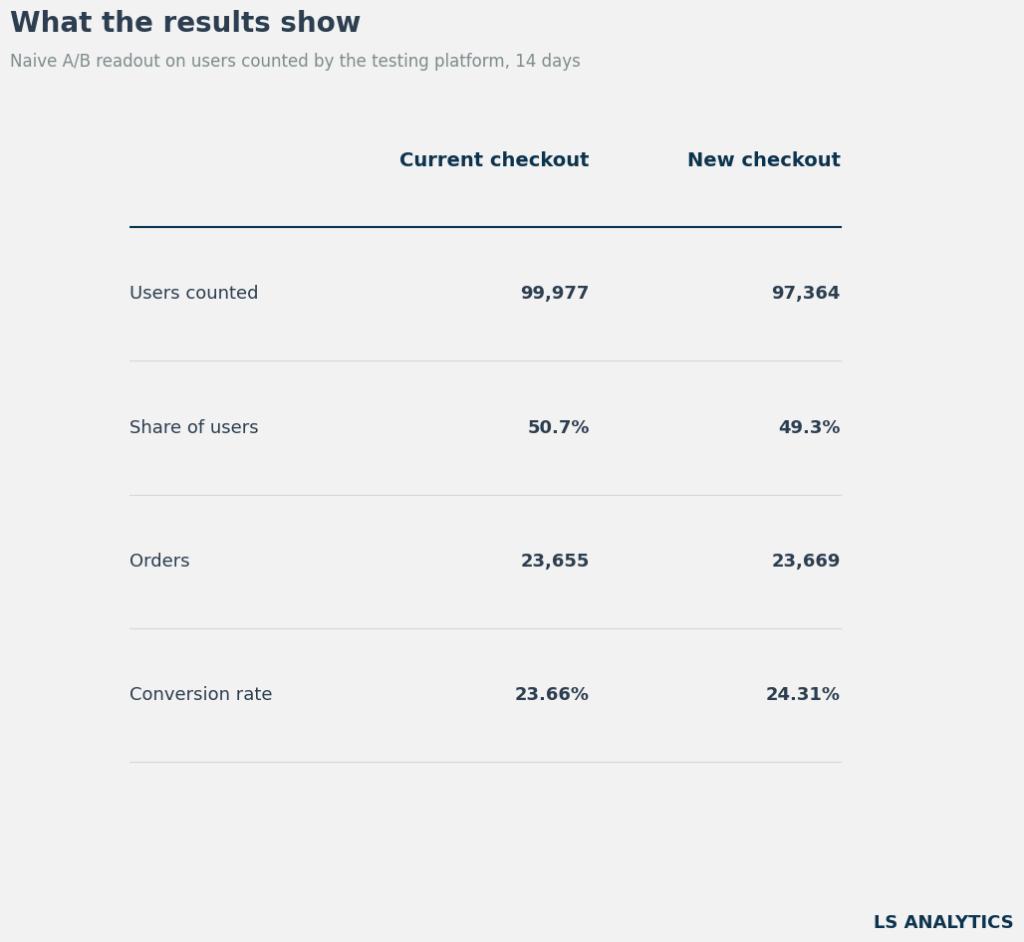
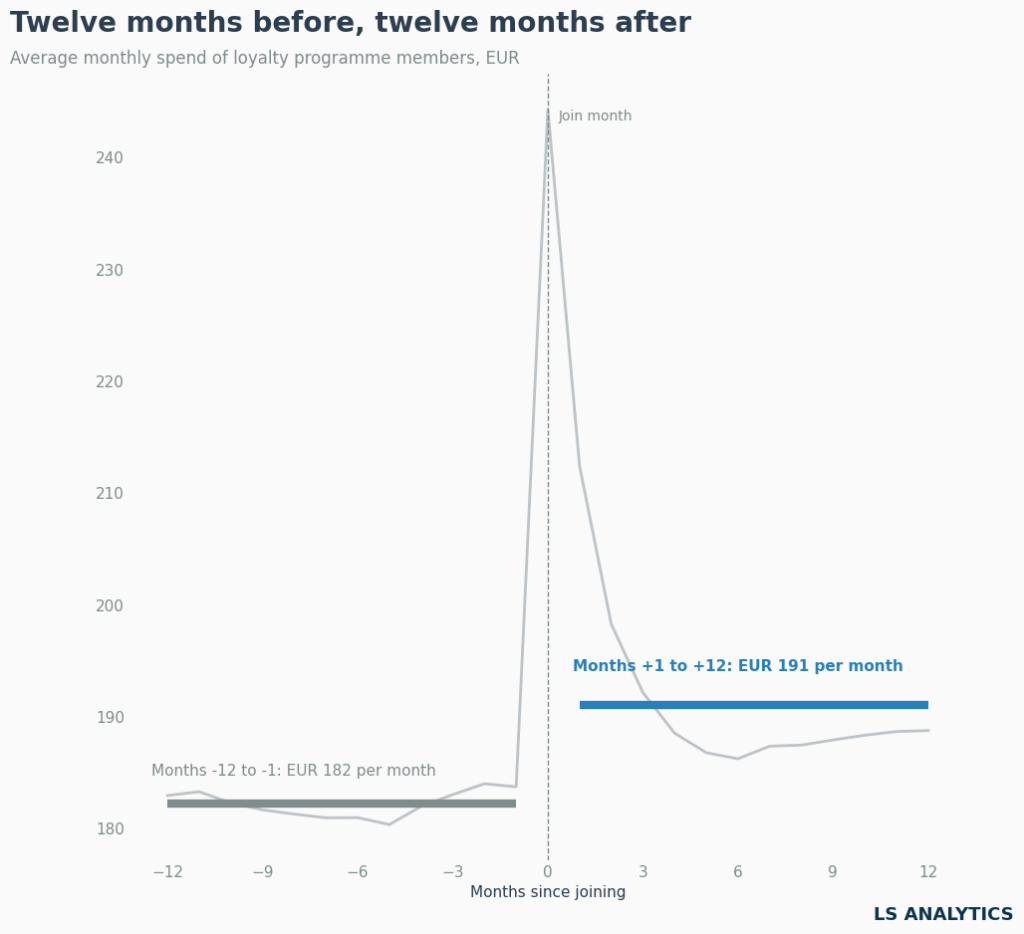
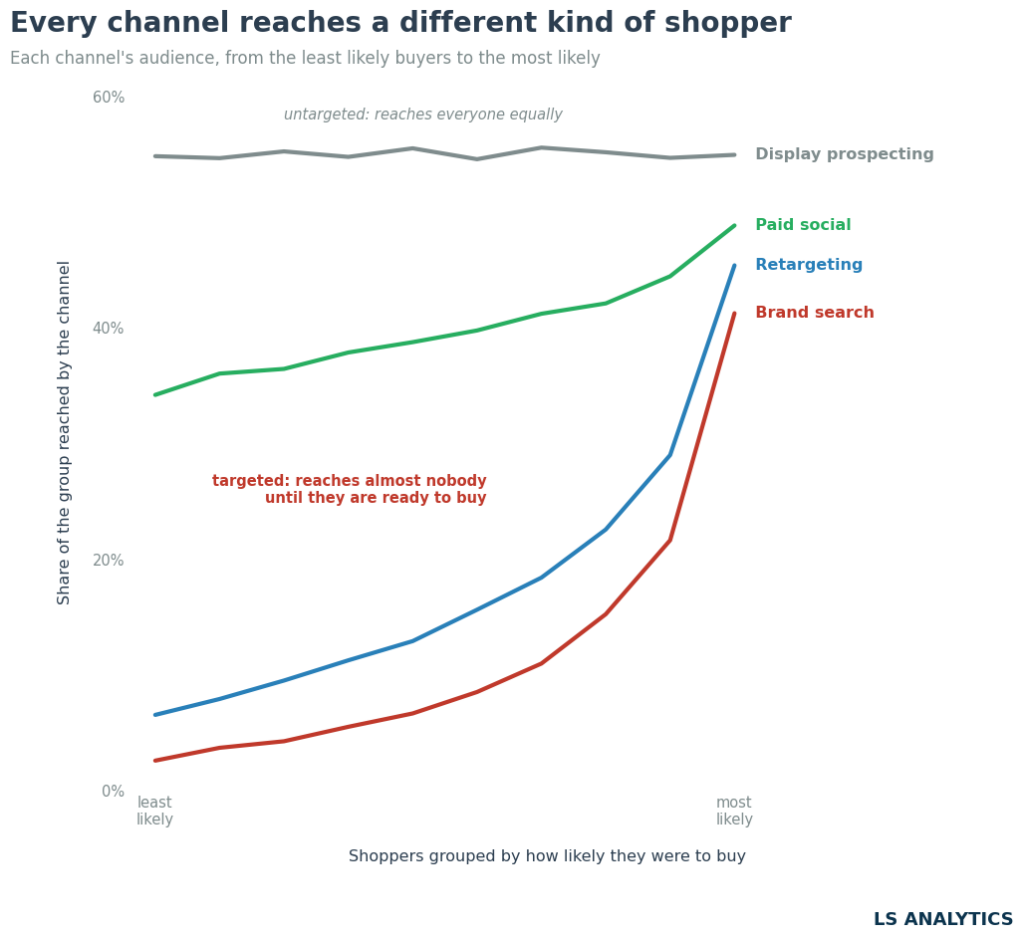
This stage needs the most care. Ask a language model why revenue fell, and it will give a fluent, plausible answer. That answer comes from patterns in the data and in its training text. But we should treat it as a hypothesis to test, not a definitive truth.
Separating cause from correlation takes study design. Experiments, difference-in-differences and synthetic control are built for this question. AI helps here too: it writes the code, checks assumptions and runs sensitivity checks. Still, the analyst designs the test and decides what counts as evidence.
Communicating results
AI is a great partner for the final step. It turns a results table into a written summary and suggests chart types. Using a language model is a great idea for generating nice, professional-looking charts, since this step is time-consuming and requires a lot of Python code. AI is also great at drafting presentations based on the results provided.
However, the recommendation stays with the analyst, including its caveats and the call on what the business should do next. Ideally, stakeholders act on that call. They need someone who can answer follow-up questions and explain the numbers.
Of course, this workflow is simplified on purpose, because real-world analytics work is messier. But breaking it down like this helps show how AI can improve ‘analysts’ lives and how it fits into broader work patterns. And crucially, we have to remember that large language models are just models. They can make mistakes, and without human oversight, those mistakes can compound, erode trust in the data, and lead to worse decisions.
Where AI for data analysis still fails
AI gets more of the analytics workflow right every year. The places where it still goes wrong are worth knowing in detail, because they show where an analyst adds the most value. Four of them are worth highlighting.
Real company data is harder than benchmarks
Text-to-SQL tools score well on academic tests. Real company databases are messier. The Spider 2.0 study (ICLR 2025) built 632 tasks from real enterprise workflows, with large schemas, several SQL dialects and multi-step queries. The best agent it tested, built on OpenAI’s o1-preview, solved 21.3% of them. The same kind of system solved 91.2% of tasks on the older, cleaner Spider 1.0 benchmark.
Of course, since then the model has improved a lot, and their performance is much better. However, the lesson still matters: a tool that impresses in a demo on a tidy sample database may struggle in your warehouse, with legacy tables, unclear column names, and years of workarounds.
Wrong answers look like right answers
A query that fails due to technical errors is very easy to spot. With AI, the bigger risk is a query that runs cleanly and returns a believable but wrong number. It might join the wrong tables, double-count refunds or use a different definition of an active customer.
dbt Labs tested this in 2026 on an insurance dataset of 11 business questions, each run 20 times. Models writing SQL directly from the schema got 64.5% of answers right, which is quite a large error rate. When questions went through a semantic layer, where metrics and joins are defined once in advance, accuracy reached 100% on the questions that layer covered. For questions it didn’t cover, the semantic layer returned an error instead of a guess.
Accuracy improved most when we wrote down the business logic, more than when we changed the model. Defining metrics clearly is analyst work, and it makes every AI tool on top of it more reliable.
Correlation is easy to mistake for causation
Language models are good at explaining why a number moved. They give fluent, plausible stories. A plausible story is still a hypothesis.
In the Corr2Cause study, researchers gave 17 language models over 200,000 test cases. Each case asked the model to work out causal links from a set of correlations. All 17 performed close to random. The models tested date from 2023, and newer reasoning models do better on some causal tasks. A 2025 review still concluded that language models should support causal analysis, leaving causal conclusions to formal methods.
For analysts, this means AI can draft the list of possible causes and write the code to test them. Designing the test and deciding what counts as evidence remain human work. Experiments, difference-in-differences and synthetic control exist for exactly this question.
Context lives outside the data
Some of the most important facts never reach the database. For example, a price change went live on a Tuesday afternoon, a tracking tag broke for three days in March, a competitor opened a shop next door.
An AI model sees only the data and the prompt it receives. An analyst who knows the business brings that context to every analysis. It often decides whether a finding means something or nothing at all. Teams that combine both get the best results: AI handles the volume, and the analyst supplies the context.
What to focus on now
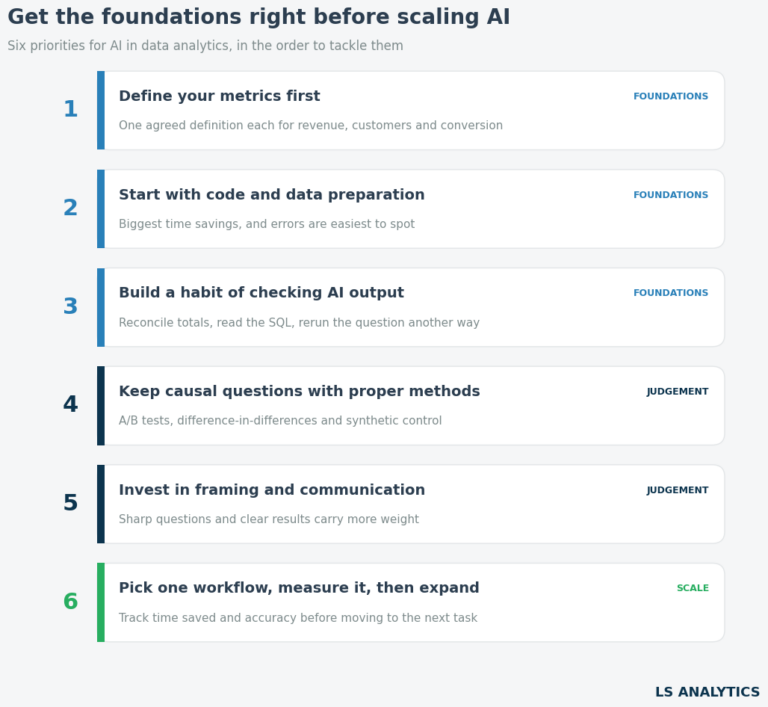
Large language models improve every few months, if not even faster. Different AI tools and agent applications make adoption a critical skill. However, we can distinguish a few critical skills for data analytics in the age of AI, regardless of the model used. Let’s take a look at them.
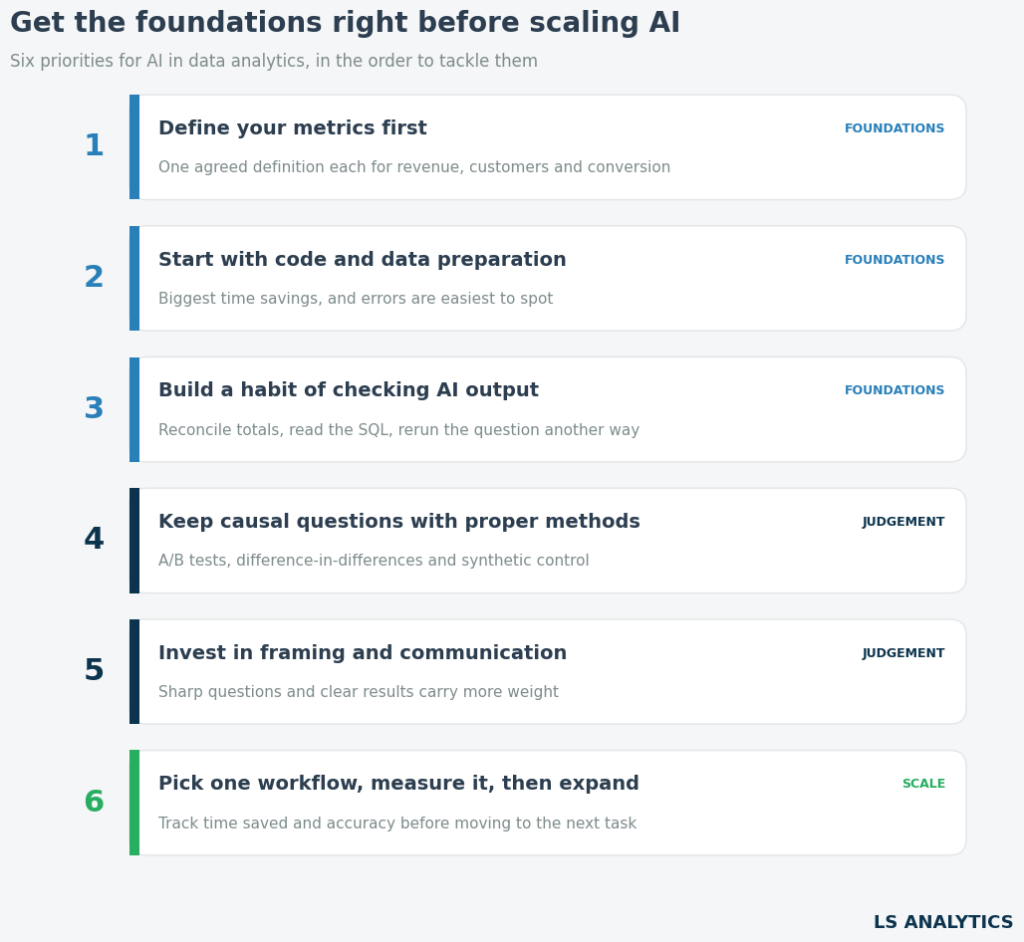
1. Define your metrics before adding natural-language querying
We’ve already seen that question-answering accuracy rose most when the business logic was clearly defined and written down. We have to agree on one definition for each metric, like revenue, active customers and so on. It’s worth creating semantic views that define the tables and joins needed to calculate the desired metric. This way, both end users and large language models use the same definitions, making it much easier and more accurate to answer business questions.
2. Start with code and data preparation
AI saves analysts the most time by writing SQL, building scripts, reshaping data, and generating visuals. Errors here are also the easiest to spot because a query either returns sensible totals or it doesn’t. Early wins here build trust in the tools and free up hours for harder work.
3. Build a habit of checking AI output
Treat every AI-generated result as a first draft, not a final outcome. AI is here to help us, not to replace us. It’s always worthwhile to compare totals against a report we already trust to check whether AI-generated data is reliable. Reading the AI-generated code is also essential to understand how a given solution was generated. After all, AI is only a tool, and the analyst remains responsible for the answer’s validity.
4. Keep causal questions with proper methods
When a stakeholder asks whether a campaign worked or what caused a drop, use methods built for that question. A/B tests, difference-in-differences and synthetic control give answers you can defend. AI makes these methods faster to run: it writes the code, checks assumptions and drafts the write-up.
5. Invest in framing and communication skills
As AI takes on more of the mechanical work, the skills at both ends of the workflow carry more weight. Analysts who turn a vague request into a sharp question deliver more value. So do analysts who explain a result in terms a decision-maker can act on. Both skills are trainable, and both become more useful as AI produces more drafts to review.
6. Pick one workflow, measure it, then expand
Choose a single recurring task, such as a weekly report or a standard data preparation request. Record how long it takes today, bring in AI, and measure again next month. Track accuracy alongside time saved and the value it provides to the organisation. These results make the case for the next workflow and show where the tools add value and where they aren’t needed. After all, AI doesn’t have to apply to everything; sometimes a simple automation is enough.