Most business machine learning models predict what will happen next. Which customers are likely to cancel, how many products will we sell next month? Decisions based on those predictions often ask a different question. They ask what will change if we act, for example, by offering a discount or changing a price.
The two questions often have different answers and lead to different decisions. A customer who is very likely to leave may leave regardless of what we offer. Another customer might be worth offering an incentive, as it will help the business retain them. Most of the debate about causal AI vs machine learning comes down to this gap, and the gap can cost money.
Causal AI refers to methods built to answer the second question. They estimate the effect of an action, such as how much churn falls when a customer gets a discount. They use machine learning algorithms, but their goals differ. A predictive model learns patterns from past data. A causal model tries to separate an action’s effect from what would have happened anyway. This term is relatively new and is often used quite loosely. However, these methods stem from decades of work in statistics and econometrics. They include randomised experiments, difference-in-differences, synthetic control and newer techniques that combine causal inference with machine learning.
Churn modelling clearly illustrates the difference between causal AI and machine learning. In the simulated data used for this article, only 23% of the customers a churn model rates as riskiest would actually be kept by offering them a discount. The rest would stay anyway or leave regardless of what they’re offered.
This article will explore where traditional machine learning does well and where it stops. It then explains what causal AI covers and sets the two side by side. We will also use simulated data to show differences between machine learning and causal AI and identify when each method is most beneficial.
What machine learning does well
A supervised machine learning model learns patterns from historical data and uses them to predict an outcome for new cases. For churn modelling, we can use two years of historical data with features such as customer tenure, login activity, spending behaviour, and support interactions. The target variable indicates whether customers cancelled their subscription. The model learns the combinations of features that predict the target as well as possible. Then, it applies the model to a new customer and returns their churn probability.
This approach works well for a large class of problems. Fraud scoring and demand forecasting are two of them. In each case, the business needs to know what will happen, and the prediction drives an action that doesn’t change the outcome. Flagging a transaction for review does not make it more or less fraudulent. Ordering stock because of the forecast spike doesn’t create demand.
Testing the model is also simple. We use part of the data as a test set, predict it and compare the predictions with what really happened. A model that ranks well on unseen data will likely work well next month, as long as it resembles historical patterns.
However, such an approach has limitations that matter when predictions start driving decisions.
First, the model picks up any pattern that helps it predict the target value, whether that pattern reflects the cause or a symptom. In the simulated churn data used in this article, visits to the cancellation page are the strongest predictor of churn. However, they don’t cause churn, because customers who visit a cancellation page have already decided to leave. Using such a variable might seem like an extreme prediction error, but we use it to illustrate the difference between causal AI and machine learning in a practical way.
Second, the model knows the world only as it was when the data was collected. If past discounts went mostly to loyal customers, the model correlates discounts with high customer activity. The machine learning model learns this connection without considering whether the discount drove customer loyalty or vice versa. A model trained on customers who never received an offer also says nothing about how they would react to one.
What causal AI means
Every causal question compares two versions of the world. One includes the treatment, and the other is a counterfactual world without it. In one, we see the customers who receive a discount. In the other, at the same moment, we would like to know what would have happened to the same customers without a discount. A difference between those two worlds is the causal effect of the discount.
It is much easier said than done, since only one version of this world actually exists. We are not able to see the same customer in two versions of reality, what is often called ‘a fundamental problem of causal inference’. Only one version ever happens. A customer who received the offer and stayed might have stayed anyway. No dataset shows both outcomes for the same person. Causal methods estimate the missing outcome, the counterfactual, which lets us estimate the causal effect.
Judea Pearl describes this as a ladder of causation with three levels. The first is association: customers who visit the cancellation page churn more. Machine learning works here. The second is intervention: what happens to churn if we send a discount. The third is the counterfactual: would this specific customer have stayed without the discount we sent? Most business decisions sit on the second rung, while most machine learning models in production operate on the correlational level.
In practice, causal AI applies traditional machine learning algorithms with a causal angle, usually by incorporating treatment-variable information across different variations.
One approach is uplift modelling, which estimates the effect of an action for each customer instead of a single average across the whole customer group. The most common approach uses meta-learners, which fit ordinary machine learning models within a specific framework. The simplest, the T-learner, trains one model on customers who got the offer and another on customers who did not. For any customer, the gap between the two predictions is their estimated response. The S, X and R learners combine the models in other ways. Causal forests take a different approach. They adapt random forests to group customers by how differently they respond to the offer, instead of by the outcome itself.
The second use deals with data from past business decisions, which is rarely random. Customers who received a discount differ from those who did not, so comparing the groups mixes the discount’s effect with the effect of who got it. Double machine learning separates these effects in two steps. One model predicts the outcome from customer characteristics. A second model predicts who received the treatment. The method then checks how the part of the outcome the first model cannot explain moves with the part of the action the second model cannot explain. That remaining link is the estimated effect.
Both methods work best on data from a randomised experiment, where chance alone decides who gets the offer.
Case 1: who should get the retention offer
The first case uses a simulated subscription business with 40,000 customers on four monthly plans, costing from €9.99 to €29.99. We randomly selected half the customers and offered them a 20% discount, while the other half received nothing.
In classical uplift modelling, customers fall into four groups, based on how the offer changes their behaviour.
Persuadables stay only if they get the offer. They make up 21% of the base, and the discount reduces churn by about 17 percentage points.
Sure things stay either way; they are the largest group, responsible for 67% of customers, and the offer doesn’t change their behaviour.
Lost causes leave whatever they are offered and make up 4%. Those customers shouldn’t receive any offers from us, since they have no effect anyway.
Sleeping dogs, the last 8%, are long-standing customers who rarely log in. For them, the offer backfires: the email reminds them they are still paying, and their churn rises by 12 points.
This categorisation shows that the only group worth targeting is persuadables, and a well-designed, practical churn model must focus on finding them.
The usual approach starts with a churn model. It trains on customers who received no offer and learns from tenure, login activity, plan price, support tickets, and other signals. Overall, it works well—half of the customers in its top 10% leave. The retention team could send the offer only to this group of customers y to retain them.
Before we allow them to do so, let’s check how the true churn rate and retention gain differ by scores from our first, not-causal churn model.
The chart shows why the plan underdelivers. Churn falls steadily from the riskiest decile to the safest. But the offer’s gains follow a different shape. It peaks in the third decile, and the top decile gains less than the second. The riskiest 10% are mostly lost causes and sure things. Persuadables make up only 23% of the group, and the offer pushes out 4% who are sleeping dogs. Targeting only this segment wouldn’t maximise retention gains and would reduce long-term profitability.
To better isolate the customers we would actually benefit from offering a discount, we can use a causal AI approach. This approach uses a T-learner trained on the experiment data. One model learns churn among customers who got the offer, and the other among those who didn’t. We leave cancellation page visits out of both, since they record a decision the customer has already made.
As it turns out, this approach is much more useful for building a churn model that can be applied. 92% of the T-learner’s top 10% are persuadables, and it doesn’t pick any sleeping dogs. It finds them through their characteristics: mid-tenure customers on the two higher-priced plans.
We can make the gap between the two models more concrete with a simple business case, like the chart below.
Assuming each offer costs €20 in discounts, €1,000 covers 50 customers. When sending the discount to the riskiest customers, that €1,000 keeps 2.7 customers who would otherwise have left. Sent at random, it keeps 1.7.
The real difference is clear when we send it to the customers with the highest estimated response. It keeps 9.2, more than three times the churn model’s result for the same budget. These numbers show that applying the causal AI method not only works better technically, but can also deliver much better business results and improve profitability.
The T-learner depended on one thing the churn model didn’t need: a randomised experiment. Chance decided who got the offer, so the two groups were otherwise similar. However, most business data comes from decisions someone made on purpose, and that changes the picture, as the next case shows.
Case 2: When past decisions distort the data
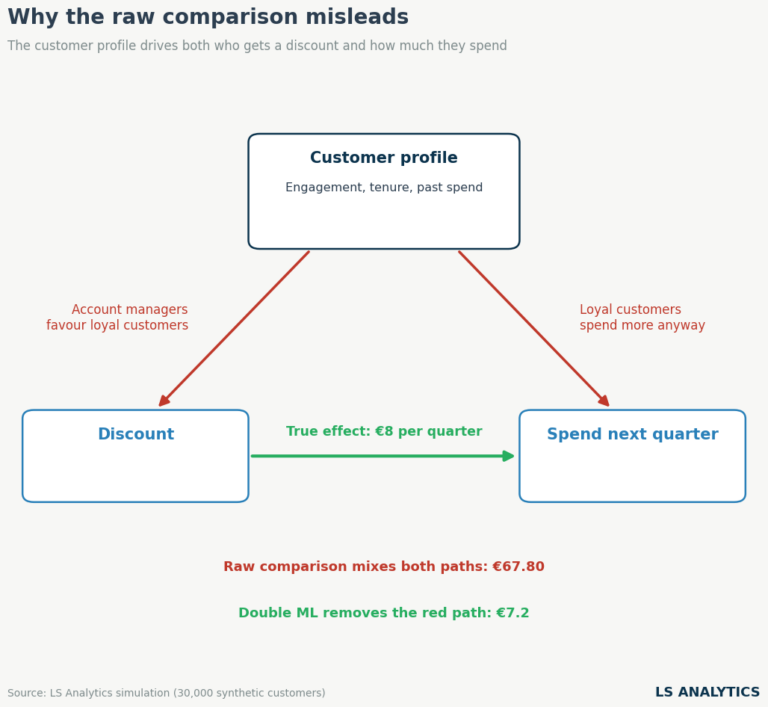
The second case takes us to a messier world in which we drop the random experiment. This time, we will simulate a business with 30,000 customers, 45% of whom received a discount last year. As in the previous case, we want to measure the effect of giving customers a discount on retention behaviour. However, this time discounts are not chosen at random. Account managers gave discounts to customers they valued, so the discounted group had been around longer, spent more and were far more engaged. In the simulation, a discount adds €8 of revenue per customer per quarter. The question is whether we can recover this estimate using causal AI.
The first estimate is, as usual, the raw comparison, to get a sense of the gap between the two groups. Discounted customers generate €67.80 more revenue per quarter than the rest. Taken at face value, the discount programme looks like one of the business’s best investments. However, these numbers have little to do with the discount itself, as these customers were already the biggest spenders. Most likely, they would have spent more with or without it.
The first case solved a similar problem with an uplift model. They do not strictly need an experiment. If the data records every factor that drove the discount, a T-learner can in principle recover its effect. However, another family of models is better suited to observational data: double machine learning. We will omit the technical details and focus on how they work in general.
First, a model predicts each customer’s spend based on their tenure, past spend, and engagement. For example, let’s take a highly engaged customer. The model might expect €180 a quarter from her. If she actually spent €185, the extra €5 is the part her profile cannot explain.
In the second step, a separate model predicts, using the same characteristics, how likely each customer is to receive a discount. Account managers favoured customers like her so that the model might put her chance at 90%. She did get one, so the discount was not surprising. On the other hand, consider a newer, less engaged customer with a 10% chance who still got a discount. For him, the discount was surprising, and his case says much more about the discount’s effect.
In the last step, the method regresses the spend residuals on the discount residuals across all 30,000 customers. The slope of that line estimates the discount’s effect. Both residuals already exclude loyalty, engagement, and spending history, so those factors can no longer inflate the slope. Customers with large discount residuals pull the line the most. Customers whose discount was predictable have less impact.
Both models from the first steps are flexible, and we can use different traditional machine learning algorithms as the base models. This shows how well connected classic machine learning is with causal AI. The final estimate from double machine learning is €7.20, within a euro of the true effect.
Double machine learning worked here for one reason: the data captured every factor driving both the discount and the spend. Without engagement data, the method could not have separated it from the discount, and its estimate would have been biased. Flexible machine learning models help capture complex, non-linear patterns in the data. But no model can recover a true causal effect if the dataset omits crucial variables that influence customers’ behaviour and discounts.
Causal AI vs machine learning: which one to use
Choosing between the two approaches isn’t really about deciding which one is universally better. Both causal AI and machine learning are powerful tools, and the choice depends on the right fit. Always start with the decision the analysis must support, and the method will follow.
When we want to know what will happen, machine learning is the right tool. Forecasting demand, scoring fraud, and planning support staff are good examples.
Deciding on a specific action, especially at the customer level, requires applying causal methods. Choosing who gets a retention offer is one example. A useful test is the question’s wording. If it contains “what happens if we” or “how much did this add”, a prediction cannot answer it, and we need causal methods.
In causal machine learning, uplift models and double machine learning overlap significantly. Both rely on standard predictive models and require the same conditions to work. They differ in what they optimise. Uplift models such as the T-learner aim to estimate the effect for each customer, making them a natural choice for targeting. Their simpler forms combine outcome-predicting models, so they work best on experimental data.
Double machine learning was designed for observational data with confounding. It removes variation explained by customer characteristics before measuring the effect, making the estimate more stable. The line between them is unclear, and we can’t say one is better than the other. Causal forests and the R-learner apply the double machine learning idea to estimate effects customer by customer. On experimental data, an uplift model is usually enough. On observational data, methods built on double machine learning are the safer choice for targeting and for a single overall number.
Some events cannot be split by customer at all. A price change applied to everyone or a TV campaign in one country falls in this group. In these cases, we compare regions or time periods, and quasi-experiments such as difference-in-differences or synthetic control are better choices.